
Article: Will Trump’s tariff war spark big-bang reforms in India?
This BBC story reports on how the Trump administration’s tariff policies are affecting India’s economic reforms. However, there are still areas can be improved. I will analyse this in terms of data visualisation, multimedia elements , user interaction and hyperlinks.
Data Visualisation
This news covers a large amount of data such as India’s import tariff levels, global trade comparisons, etc. Adding dynamic charts to the story can visualise the key data, so that readers can understand the impact of Trump’s tariff policy on India’s economy in a clearer and more explicit way.
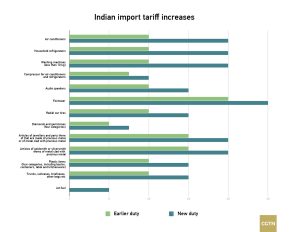
This image shows India raising import tariffs (image via CGTN)
Add multimedia elements
This news relies heavily on text reporting. If you can add short videos, such as interviews with experts or animations, you can make the content more vivid and authoritative.

Musk sat down with James Clayton for a spontaneous interview. (Photo: YouTube)
Enhanced user interaction
Add a comment section or poll to the news, which allows readers to share their opinions. Such as ‘Do you think India should reduce tariffs?’ . This will help increase reader engagement.
Adding hyperlinks
Hyperlinks can be added to key terms in the article as appropriate to guide readers to relevant information, for example, key terms such as ‘tariffs’ and ‘free trade agreements’. These help readers to better understand the article.
Be the first to comment